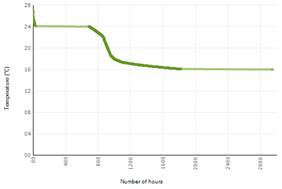
The Temperature frequency graph shows how often each temperature has been recorded over the measured time period
Defines from which room you want to view the Temperature
frequency graph
|
|
You can view only one room at a time in the graph. NOTE: Only the calculated areas are displayed. If the desired room is not present in the list, then it has not been calculated. |
Specifies on what temperature measure the program in the
ATG graph should be based.
•Comfort temperature. The local devices are controlled on comfort temperature.
•Air temperature. The air handling is controlled on air temperature.
Defines the period over which you want the requirement
profile
•The Total period is over the total period for which you have calculated. This period is defined by the selection of the Climate File.
•The Usage Period displays only the period of time when the building is in use. Defined in the Climate File, and linked to the areas Schedule of IHG viewed over the entire building
With this tool you can define manually what power limit
is needed.
