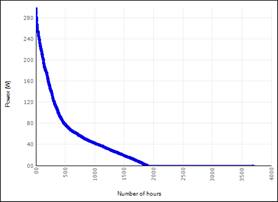
A heating load duration curve is a chart which displays the hourly heating power demand over the calculation period.
Defines from which room you want to view the Load
duration curve
|
|
You can view only one room at a time in the graph. NOTE: Only the calculated areas are displayed. If the desired room is not present in the list, then it has not been calculated. |
Here you choose what type of generator you want to show
on the load duration curve:
•Cooling. This is a blue line and represents the required cooling capacity.
•Heating. This is a red line and represents the heating capacity.
•Heating and Cooling. Both the heating and cooling capabilities are visible.
Here you choose whether you want to show the area of a
room, or the entire building on the load duration curve:
•Local relates to the power required to heat/cool the room;
•Central (air handling) to the total power required to heat / cool the air (the ability of the AHU);
•Local and central. Subject the total power to heat/cool the entire building.
With the heating load duration curve you can set the
limits of your heating and/or cooling generator.
For more information see the following standard:
|
|
ISSO Publication 50 Design Technical quality for hot water heating systems (2008) Spec II.4-7 Load Duration Curve |

