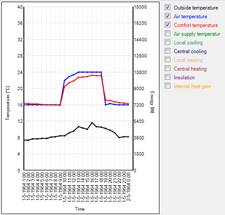
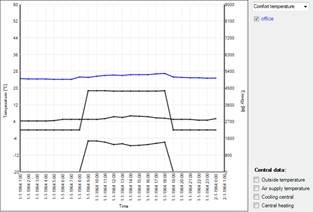
The daily output charts views daily, weekly, monthly or yearly temperature and energy statistics of all subjects to building simulation.
This specifies whether to display the results for a
single room, or multiple rooms.
•Single room, where we can see the local effects
•Multiple rooms, displays the results for multiple rooms at the same time.
Defines from which room you want to view the daily output
graph
|
|
You can view only one room at a time in the graph. NOTE: Only the calculated areas are displayed. If the desired room is not present in the list, then it has not been calculated |
[Date]
Specifies the
start date for the graph.
Defines the period over which the graph is displayed.
•Day
•Week
•Month
•Year
